Performance Monitoring
Did you ever encounter long response times or high CPU loads on your Sitecore webserver?
Most likely it was caused by an ingoing HTTP request to your webserver.
This article will show you the most efficient way of pinpointing what drains your resources.
-
Determine what URL's on your website are spending most CPU time.
The article about LogParser tool shows how you can pinpoint these.
So now you got a list of URL's to investigate for what is causing the CPU usage. If the URL's point to the Sitecore client, you should report this to Sitecore with sufficient documentation. Most likely the URL's will however point to pages on your frontend website such as www.mysite.com/sitemap.html. Download this zip file with a usefull sample of LogParser scripts. - Or use HttpWatch on a page by page basis to measure the entire "time taken" by a single page (http request form the browser). See the article here.
-
Use Debug tool to do a profile of the problematic page.
Log in to the Sitecore client, then to the URL: www.mysite.com/sitemap.asp?sc_debug=1, and enable profiling. You will now be able to see a profile of this page as in the following picture: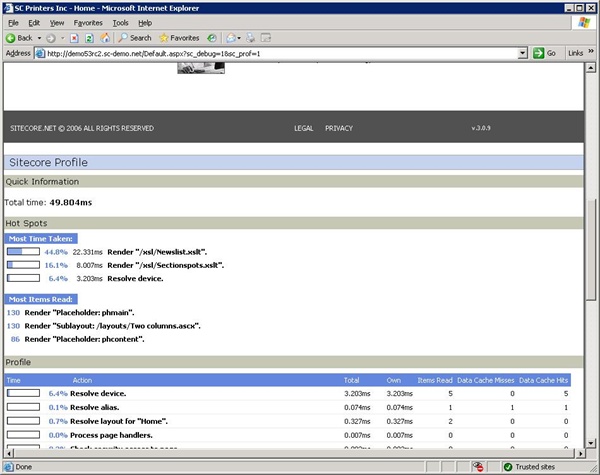
You should now be able to identify renderings such as XSLT files or webcontrols that spend too much time. Now proceed to debugging these renderings to determine the causes. Be aware of bad xpath constructs such as descendant and following axis.
If you are using Sitecore 5.1/5.2, please refer to the following page for information on finding the most resource consuming pages:
http://sdn.sitecore.net/Articles/Media/Caching%20Renderings.html
-
Don't be fooled
...by caching. The same page (and rendering) may perform perfectly fine one moment and terrible the next according to if it was rendered from cache or not. The profile tool shows if a rendering was rendered from cache. - Consider to use the dotTrace tool to see the time taken on a method by method basis in the .Net framework. See the article here.
-
What if all URL's are equally bad?
Well, you have two options, either do a profile on random pages to see what is going on or...
Use the /sitecore/admin/stats.html page to do statistics on what renderings are spending most time overall between all requests.
Tip 1: Use the website only.
Tip 2: Right click the table and choose "Export to MS Excel" to do advanced statistics (see the screenshot below).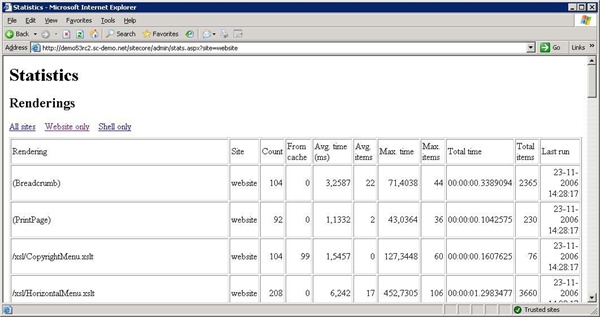
-
Performance counters
Finally, Sitecore 5.3 offers access to performance counters from within perfmon. Here you can monitor all kinds of relevant Sitecore counters, such as Cache hits and misses, number of publish operations etc.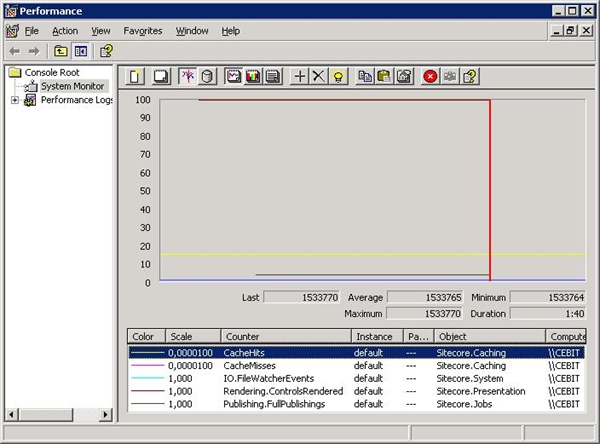
- Use WinGrep for watching trends in the Sitecore logfiles. The screendump below shows how you quickly get an overview of how much memory was used by Sitecore. :
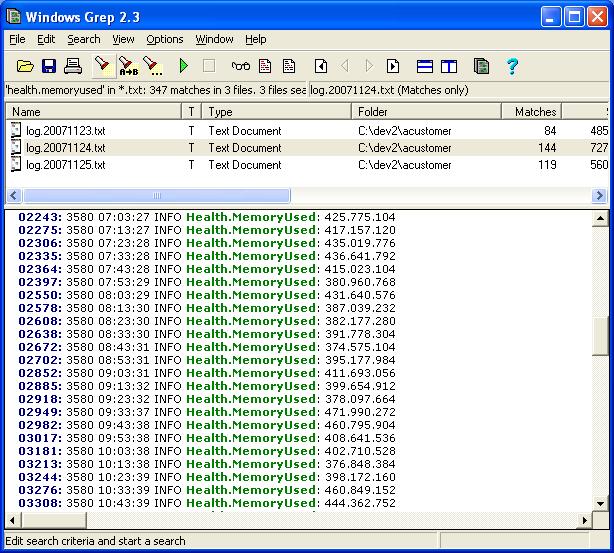
9. Use DotTrace in a development environment to debug Asp.Net: